 Signal Deck
Daily AI Stock Rankings: Which Stocks May Beat the Market
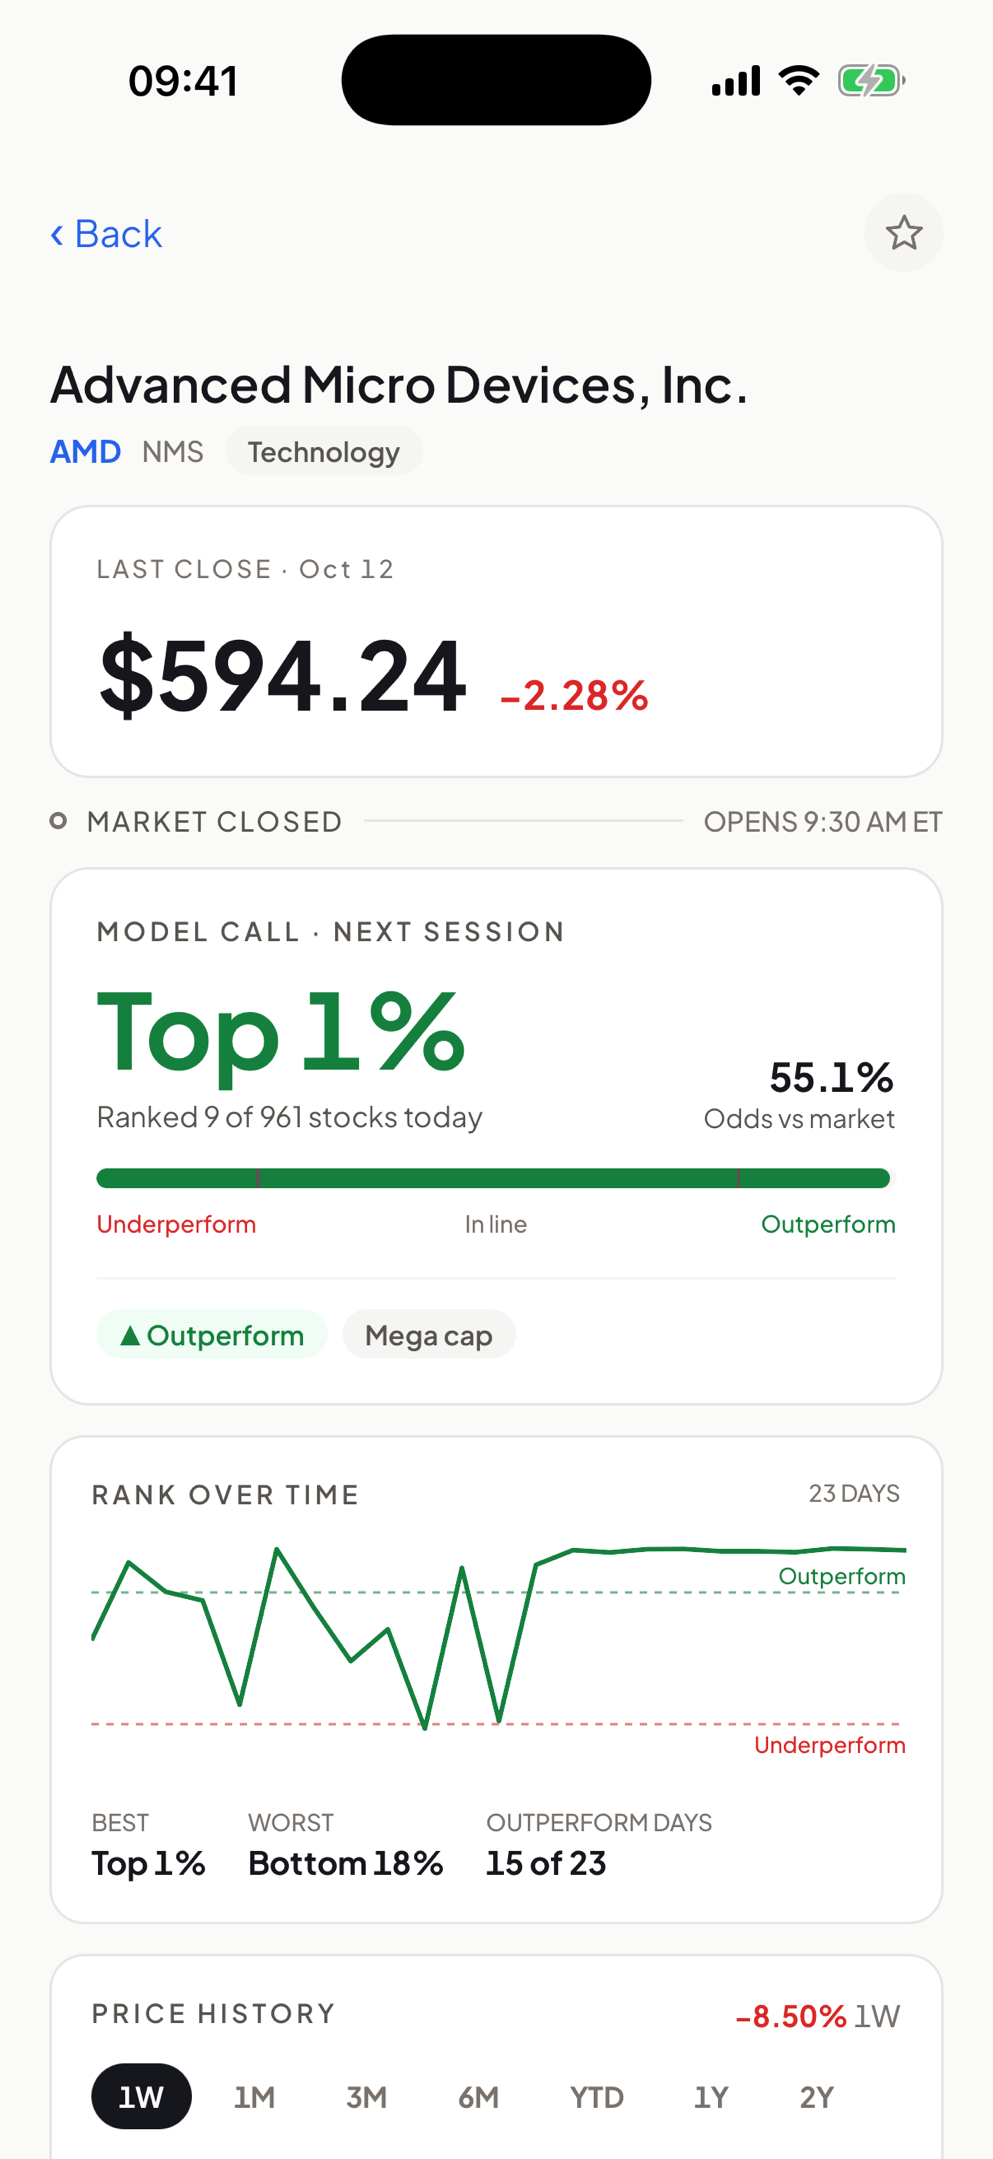
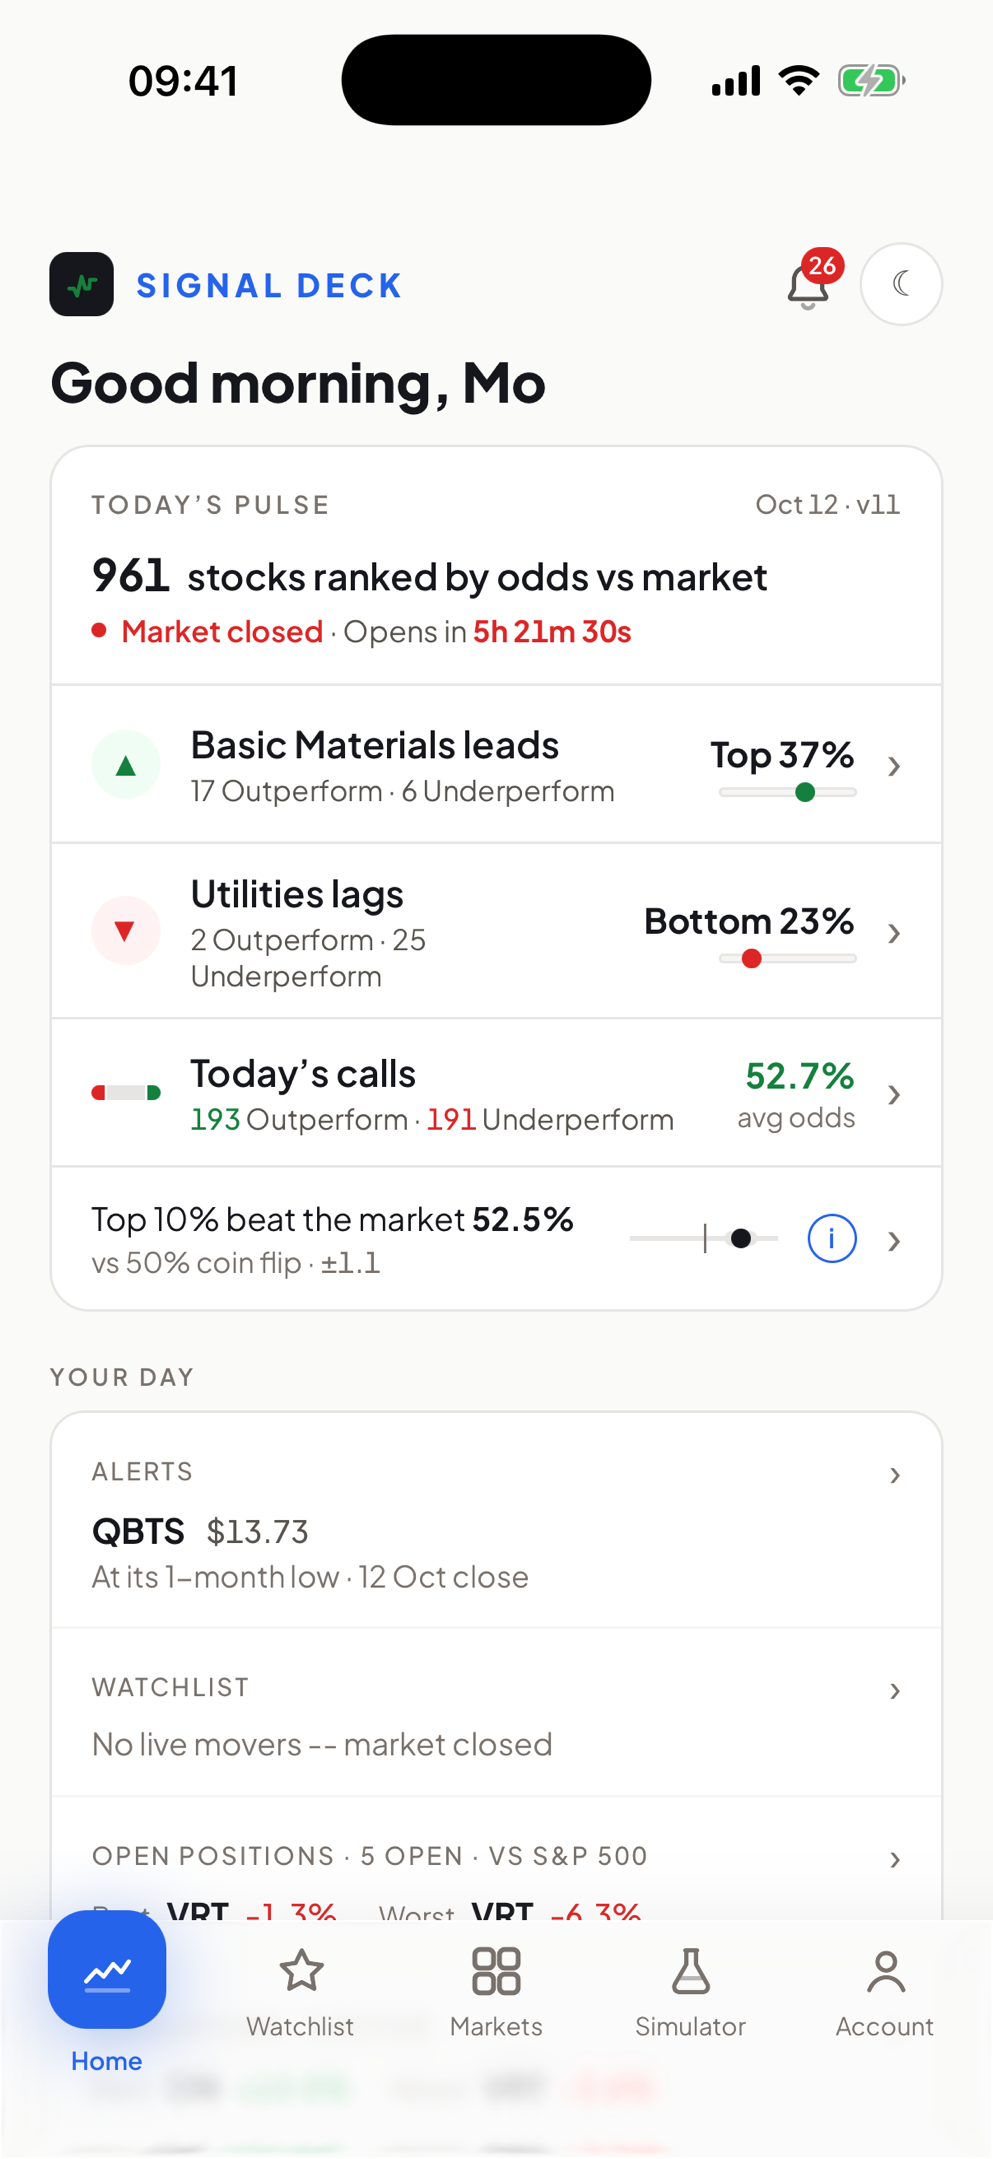
Every night a model ranks roughly 950 US stocks by how likely each is to beat the market over the next session. See today's Outperform and Underperform calls, where each stock ranks, and how honest the edge is.
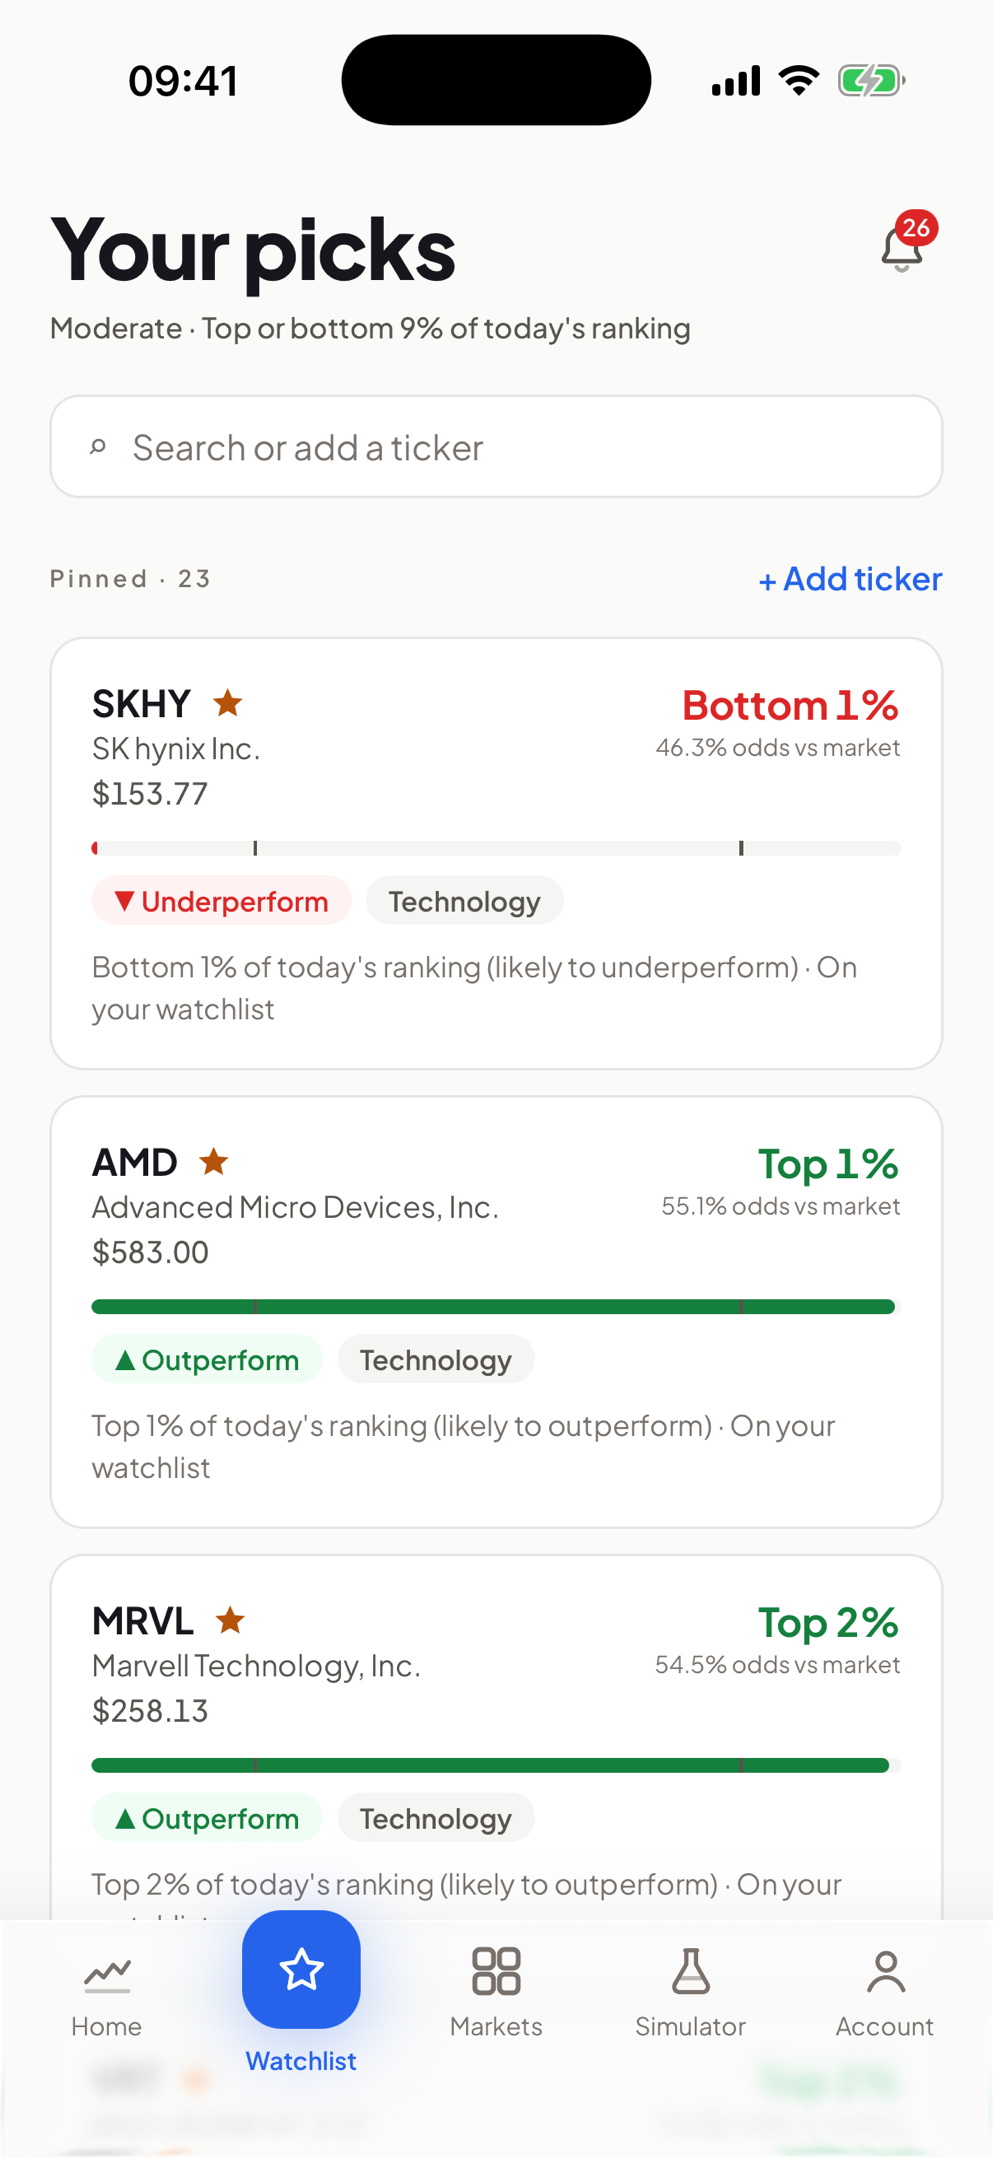
Your names, watched overnight
The site is the model thinking out loud. The app is the model watching your names and telling you when something changes.
- A watchlist that persists Pin a ticker once. It follows you to every device you sign in on.
- Told when something moves A push when a name nears its high or low, or a strategy fires on it.
- Tuned to your risk Set the bar once and only names that clear it reach you.
- Test it before you risk it Open a position with simulated money and track it for real.



Upcoming Earnings i
📅 Earnings ↗Market Headlines i
NewsTrending i
StockTwitsMarket Movers i
-Most active
Daily gainers
Daily losers
Clean Energy i
🌱 Climate ↗ETFs i
Sector Heat i
-All Signals
Ticker Lens i
-Frequently Asked Questions
Is Signal Deck financial advice?
No. Signal Deck shows model-generated probabilities for informational and research purposes only. It is not investment, legal, or tax advice, and nothing on this site is a recommendation to buy or sell any security. See the full disclaimer.
How are the predictions generated?
A LightGBM model, walk-forward cross-validated, scores each tracked ticker daily using price/volume-based features (returns, moving averages, volatility, relative volume) plus how each stock moves relative to its sector and the S&P 500. The output is each stock's odds of beating the median stock among the roughly 950 US stocks we track over the next trading session, not a price target. Because those odds cluster close to 50%, the site leads with each stock's rank in that day's list. In walk-forward testing the top-ranked tenth beat the median stock about 52.5% of the time and the bottom-ranked tenth about 48%, a small edge rather than a sure thing. Each prediction also shows a confidence interval. A narrower range means the model's internal estimates were more consistent.
How often is the data updated?
Prices, model features, and predictions refresh once a day after US market close on trading days. Market headlines and per-ticker news refresh every 3 hours, all day, every day.
What do "Outperform" and "Underperform" mean?
Outperform means a stock ranks in the top 20% of that day's list, the names the model rates most likely to beat the median stock we track over the next session. Underperform means the bottom 20%. Everything in between is In line. "Top 4%" means only 4% of scored stocks ranked higher. These are relative calls, not guaranteed outcomes: an Outperform stock can still fall if the whole market falls.
Is Signal Deck free to use?
Yes. It's a solo-run project; running costs (market data, compute, hosting) are covered by voluntary sponsorship, not by charging for access.